Economic Data – ISM Non-Manufacturing Business Report
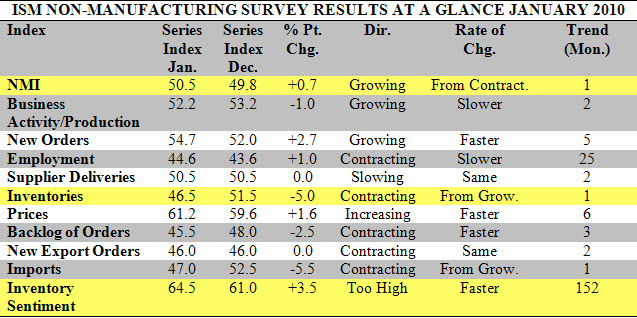
On February 3, the U.S. Non-manufacturing Report on Business was released with data on January’s actions. As seen in the chart above the NMI Index number for the month of January was 50.5, indicating expansion. The index oscillates above and below 50 to indicate expansion or contraction among fifteen non-manufacturing industries in the U.S. This is an important indicator for the U.S. economy, as it has become primarily non-manufacturing associated over the years. As January’s number was .7 points higher than December, the indication is growth in the sector, however there is more to read between the lines.
There are two other areas in the report that stand out (highlighted above). Inventories have actually begun contracting; a sign that businesses may not think the economy is growing fast enough to keep up with current inventories. At the same time, Inventory Sentiment actually increased to extremely high levels, “Too High” as report by ISM. This could be signaling a “top” in inventories as there is obvious negative divergence between the indicators.
Along with the report, when evaluating the Non-Manufacturing Index’s industry movements, four industries reported growth, while eleven reported contraction. In other words, 73% of the service industry reported contraction, while the index number would indicate expansion across the board. When reading what respondents had to say about the index numbers, it is obvious that the index alone is misleading. Most responses were negative or mixed, being wary of future growth and preparing for price increases and possible inflationary pressure.
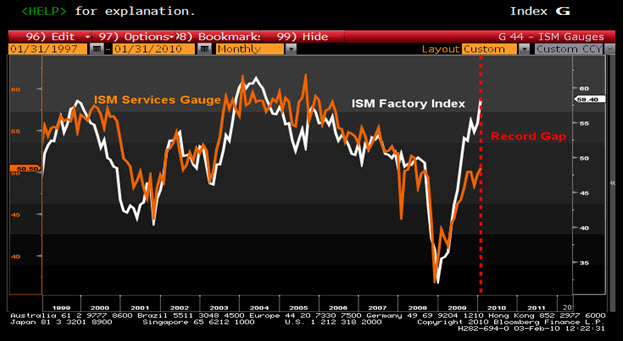
Another interesting divergence within ISM indices this month was between the Manufacturing (Factory) and Non-Manufacturing (Services) Indices. As noted by analyst Bob Willis (Bloomberg), the gap between the two indices has reached a record. The Manufacturing Index has reached its highest point in five years, while service inventories actually contracted over the past month. As reported, “The jump in manufacturing was the result of efforts to stabilize inventories after running down the supply of goods during the recession.” Willis says “That is why the government has talked about new stimulus. If they were convinced the growth numbers were for real, they probably wouldn’t talk about another stimulus.” The divergence can be seen in the chart below.
-A.Tarhini
Toyota’s Troubles Deepen
Unfortunately, the damage to the world’s biggest car maker may be lasting. Toyota Motor Corp (TM) faces at least 29 lawsuits filed on behalf of customers in the U.S and Canada seeking a range of damages from loss of cars’ value to a return of profits. The suits were spurred by multiple recalls by Toyota and its Jan 26 decision to stop US production and sales of eight models to fix defective accelerator pedals. Approximately 8 million Toyota vehicles have been recalled worldwide.
Toyota announced on Feb 1 that it had produced a remedy for the sticking pedals and poor fitting floor mats (another massive recall late last year). By fixing a steel reinforcement bar in the accelerator pedal’s mechanism, Toyota claimed this would fix the problem. However, US authorities are investigating whether faulty electronics are to blame. In addition, Toyota has stated that there have been problems in the brakes of the latest Prius, which both Toyota and U.S authorities are investigating.
Toyota estimated the costs of the recalls at $2 billion in the first quarter alone. Simultaneously, Toyota’s U.S sales fell by a whopping 16% last month while General Motor’s (GM) and Ford’s (F) rose 15% and 24$, respectively. Nissan sales rose by 16%, while Hyundai, the fastest-growing volume brand in America last year, grew by 24%.
– A. Medina
Unemployment
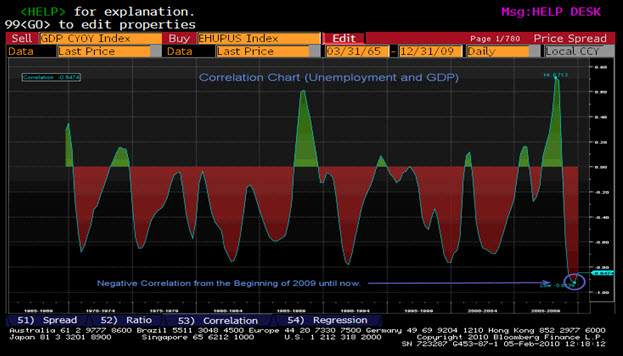
Analysts were surprised Friday when the national unemployment rate came in better than expected at 9.7 %. The unemployment rate had been stuck at 10% over the last few months and some analysts expected as much as an increase from 10% to 10.3%. However, this event seems less surprising when one considers a historical negative correlation between unemployment and GDP. GDP grew by 2.2% in the third quarter of 2009 and by 5.7% in the fourth quarter of 2009. Seeing that Unemployment is an indicator which lags, some analysts speculate that unemployment has peaked at 10% and will continue lower throughout the year. Seeming to validate this hypothesis, the underemployment rate also ticked down from 17.3% underemployed to 16.5% underemployed. This statistic is taken from the Bureau of Labor Statistics which computes the percentage of workers unemployed, employed part time for economic reasons and all other “marginally attached” workers as a total percentage of the civilian workforce. Marginally attached workers are those who are currently not seeking employment but who are interested and are available for work.
Even so, the market still opened down and by 10 AM on Friday the S&P was trading six points lower. After a sell off throughout the week that left the DOW Jones Industrial Average back at the 10,000 level and the S&P below its 100 day moving average, investors and speculators alike are beginning to wonder if this is the beginning of a correction. The S&P rallied 67.58% from its March low in 2009 and has already dropped 6.30% in 2010 from its close in December. It seems that worries about increasing regulation of the financial industry and the end of stimulus money flowing in March has investors worried about a recovery that is still on shaky ground.
– R. Belsky
Article submitted by: Alex Tarhini, Alejandro Medina and Robert Belsky of the Capital Markets Lab (CML). To learn more about the Capital Markets Lab please visit https://business.fiu.edu/capital-markets-lab/.


